The question
If a supplier retains an important customer after disruption, has it become more resilient? The answer depends on what resilience means. Continuing a relationship and maintaining or recovering operations are both valuable, but they are not the same outcome. This study asks which dimension underlies the positive resilience signal associated with policy exposure around a supplier’s linked chain master.
Setting and identification
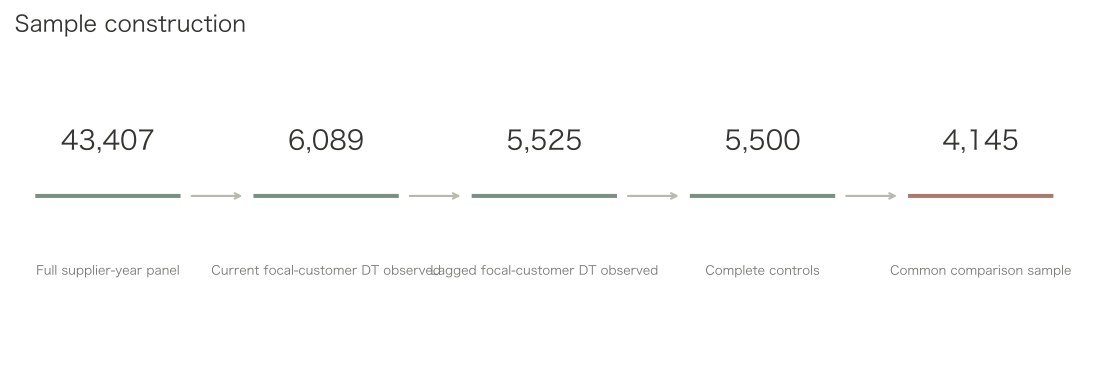
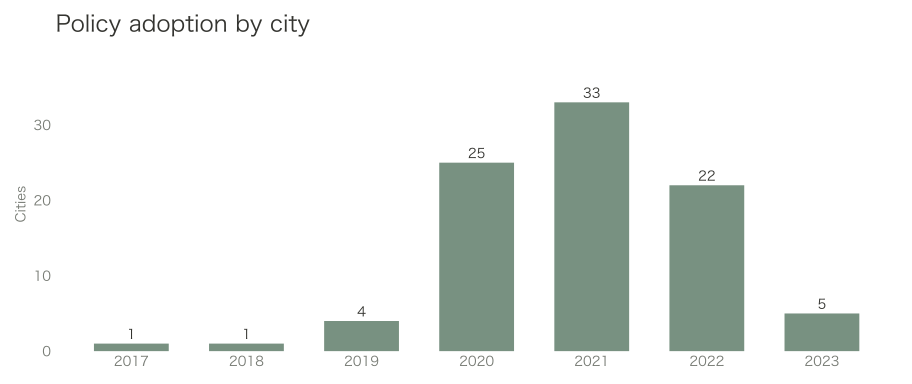
The setting is a panel of Chinese A-share suppliers from 2012 to 2024, comprising 43,407 supplier-year observations. Each year, disclosed top-five supplier and customer ties are used to build a directed supplier-to-customer network. Within each weakly connected component, the firm with the highest degree centrality is identified as the chain master, with closeness centrality used to break ties. Policy exposure is then mapped through the chain master’s city: a linked upstream supplier is exposed when that city has adopted the Chain-Head System policy and the observation occurs in or after its adoption year. The models include supplier and year fixed effects, firm controls, and standard errors clustered by supplier. The estimates are preliminary policy-exposure reduced-form evidence. They are not estimates of a direct causal effect of chain-master digitalization. Although the policy is associated with customer-level digitalization, the supplier-level first stage is weak; the main estimates therefore do not support a strong instrumental-variable interpretation.
Outcome-specific estimates
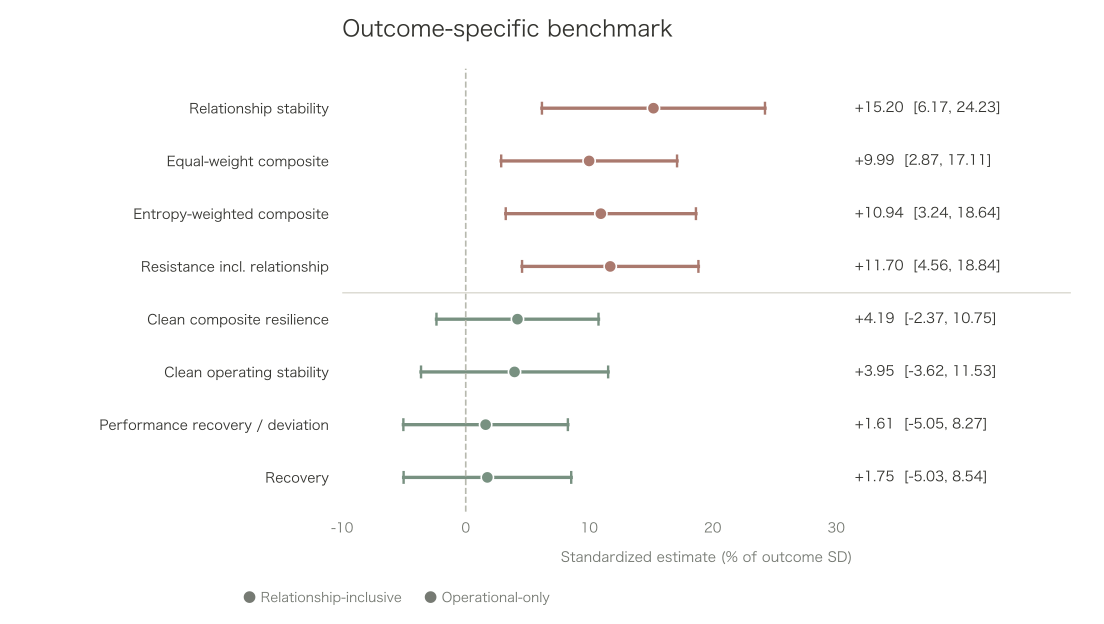
On each outcome’s available sample, four measures that contain customer retention or relationship-continuity information have positive estimates. Relationship stability is estimated at 15.20% of one outcome standard deviation. The equal-weight and entropy-weighted composite resilience measures are estimated at 9.99% and 10.94%, respectively; a resistance measure containing a relationship component is estimated at 11.70%. Their 95% confidence intervals lie above zero, and the estimates survive adjustment within their outcome family. Once the relationship component is removed, estimates for the clean operational composite, operating stability, and two recovery-related measures range from 1.61% to 4.19%. All four confidence intervals include zero.
A like-for-like comparison
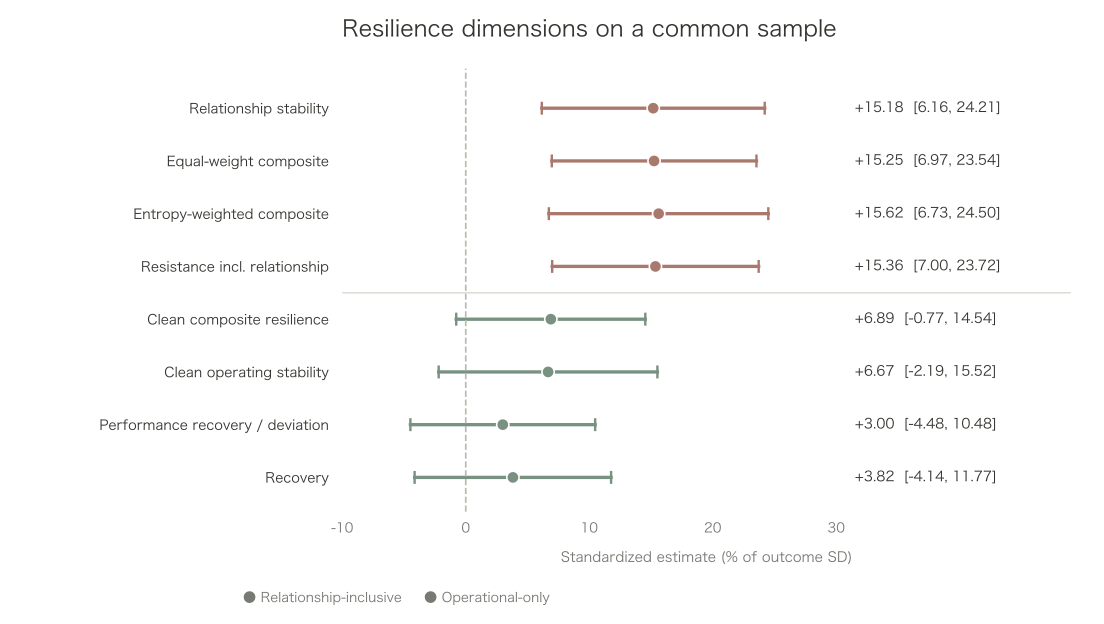
Outcome availability differs, so a supplementary slide compares the two families on exactly the same 4,145 supplier-year observations from 1,494 firms. The relationship-inclusive estimates cluster between 15.18% and 15.62% of an outcome standard deviation and retain a clear positive pattern. Clean operational estimates range from 3.00% to 6.89%, with confidence intervals still crossing zero. The correlation between relationship retention and the clean operational composite is only 0.066, providing descriptive support for treating them as distinct dimensions.
What the evidence means
These findings give a more precise meaning to a claim that “supply-chain resilience improved.” In the current conference specification, the positive signal is concentrated in relationship continuity and composite measures that contain relationship information. The evidence for stronger independent operating stability or recovery is less clear. This does not establish a zero operational effect. Nor does significance in one outcome family and insignificance in another, by itself, prove that their coefficients differ. Formal cross-outcome comparisons remain ongoing.
The open question
The open question is whether stabilizing a key customer relationship eventually helps a supplier build its own operating capabilities. Answering it will require more direct mechanism evidence and a longer view of supplier outcomes. For now, the study offers a disciplined way to discuss digitalization and supply-chain resilience: identify whose policy environment is measured, and which kind of resilience is changing.
About this article
This is a web edition of research published at the conference. Figures are taken from the conference presentation; raw data are not provided on this site; all results are preliminary policy-exposure associations and are not causal estimates.
Original title: The Resilience Effects of Chain-Master Digitalization Differ Across Outcome Dimensions: Relationship Continuity and Operational Outcomes among Upstream Suppliers. 2026 POMS International Conference in China, Sustainable Supply Chain track.